A heatmap is a graphical representation of a 2-D array using different
colors to represent different ranges of values. Heatmaps are useful in
a variety of applications, including
web usability,
sportsanalytics, and
manygeographicapplications.
Our application is search-and-rescue: given a GPS track, we want to
generate a heatmap to see
where in the search area the track hasn't been as often so that we can
focus future search efforts on those locations.
A GPS track is a collection of trackpoints
each containing a location and timestamp. Trackpoints within tracks
are ordered by increasing timestamp and can be organized into multiple
segments within the same track (a tracking device might, for example,
start a new segment each time the user pauses the device, starts a new lap,
or when the devices loses the signal from the satellites).
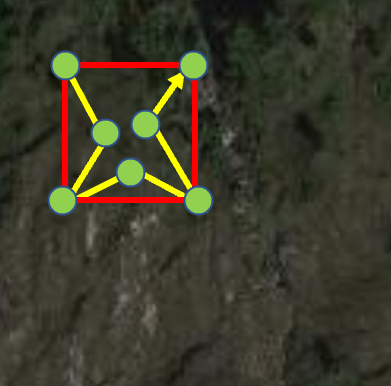
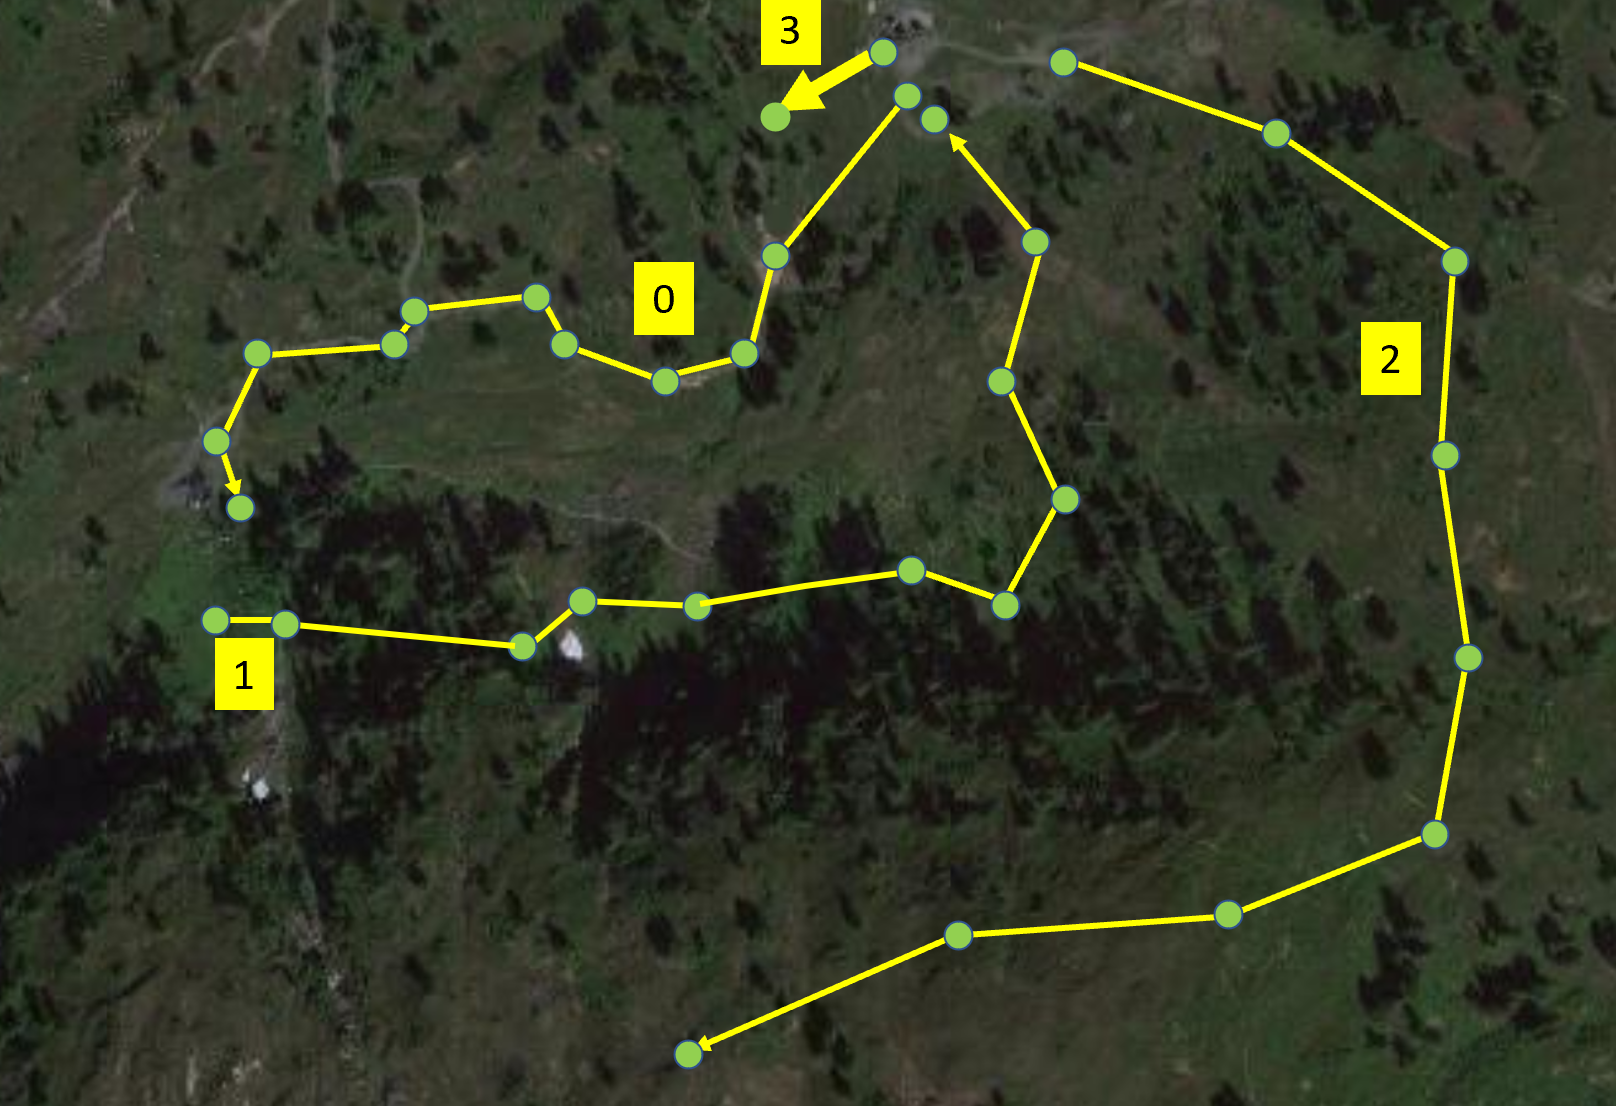
A track with 5 segments. Labels
indicate the segment indices. Arrows indicate the direction of increasing time along a segment, and the bold segment is the current (last) segment.
Operations on segments allow adding points to the current (last) segment,
starting a new segment, merging segments, and querying segments.
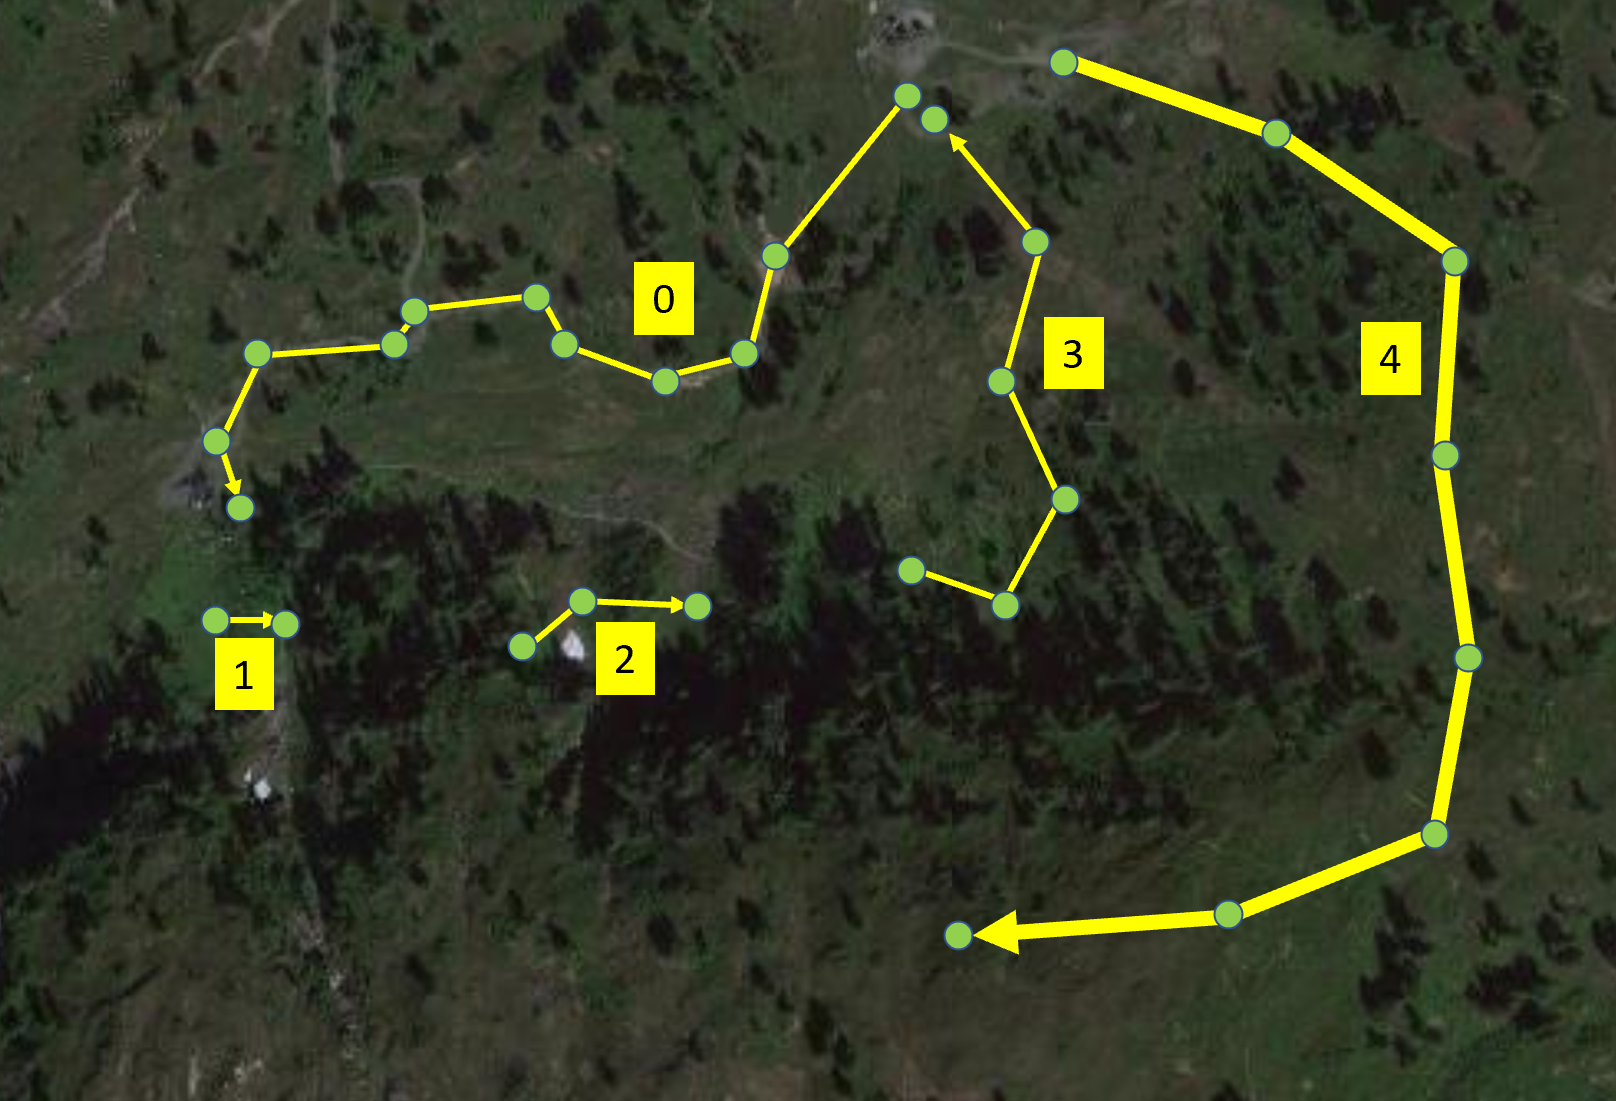
The track above after adding the red track point.
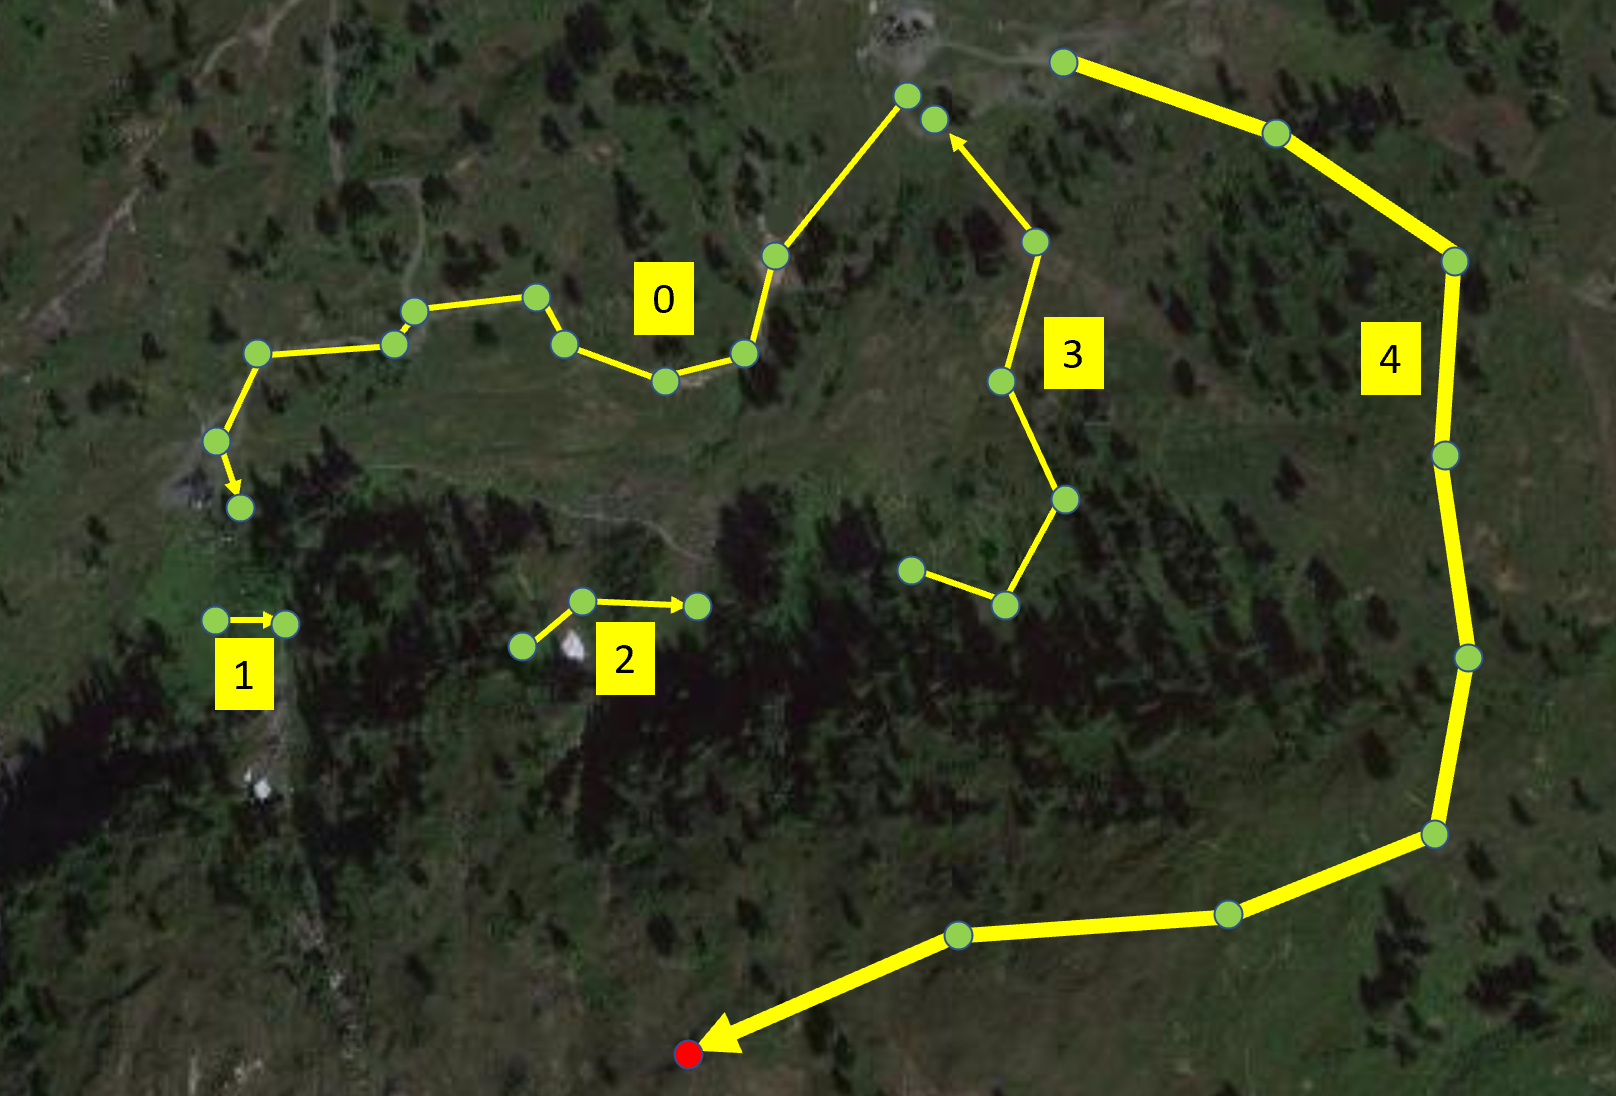
The previous track after starting a new segment and adding two track
points to it (the pink then the red).
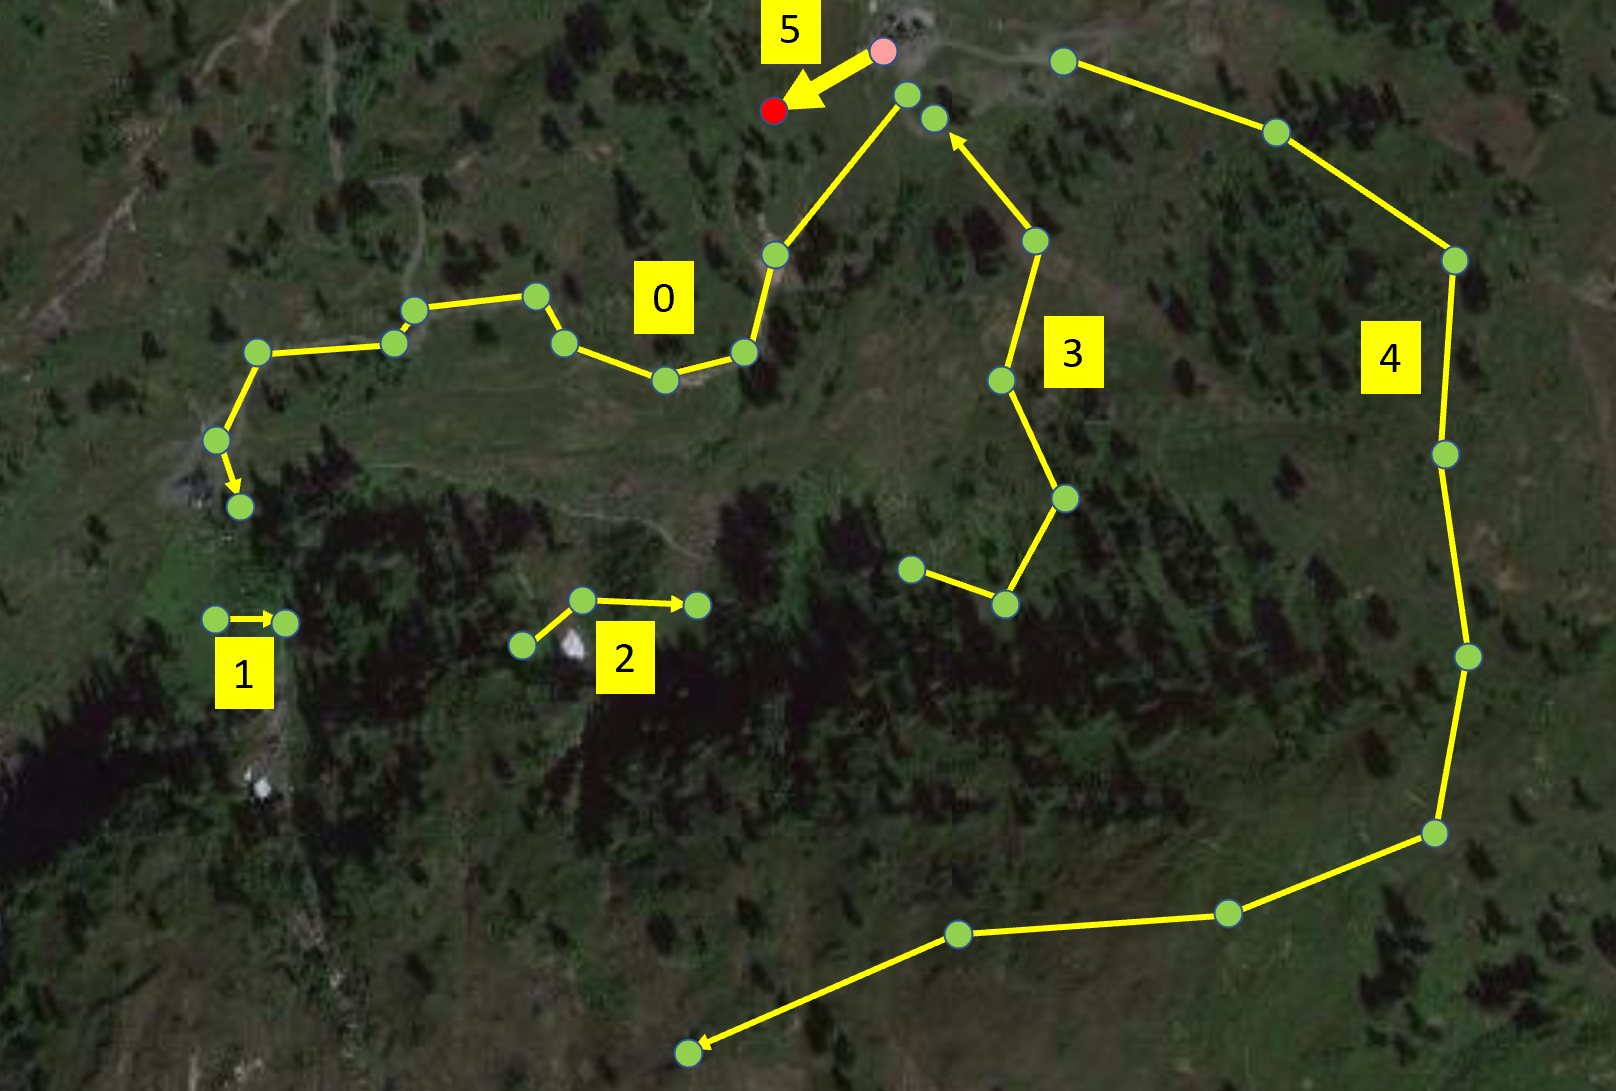
The previous track after merging segments from 1 up to but not including
4.
Given a track and a grid size, we can create a heatmap by counting the
number of track points within each grid cell (note that we count track
points and don't consider the time between those track points).
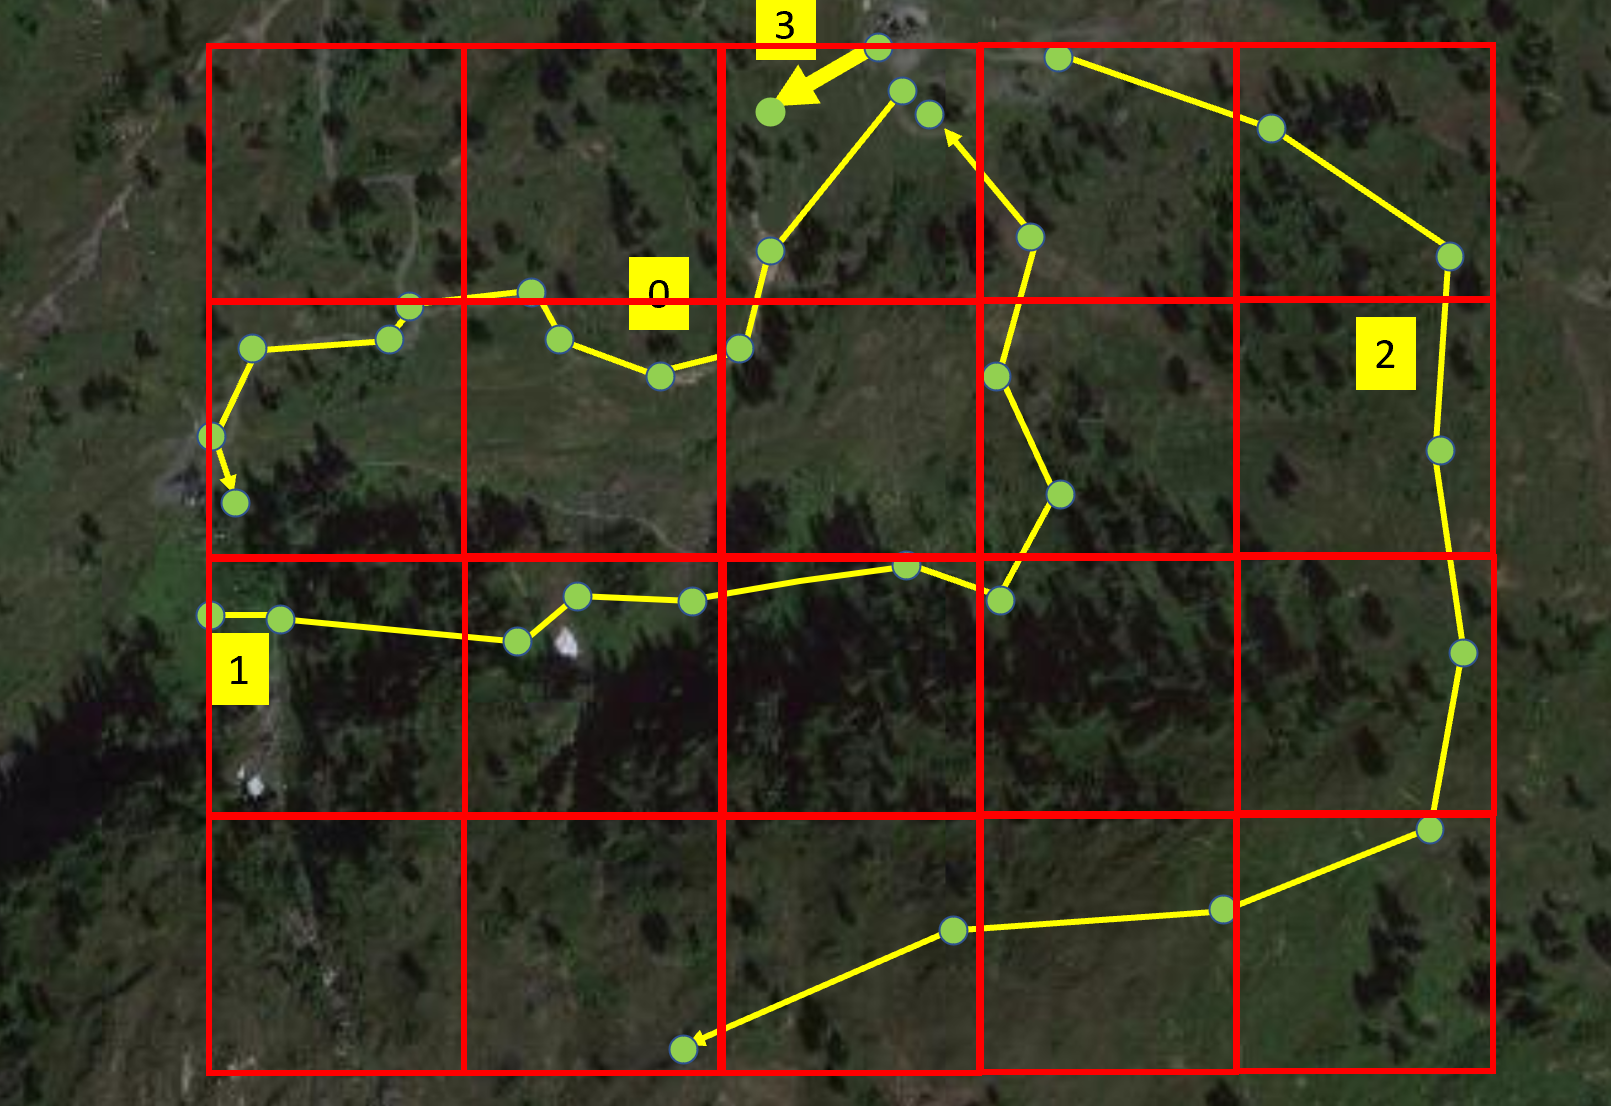
A grid superimposed on a track.
The resulting heatmap. Darker colors represent more track points
within the cell.
Overview
Write a program called Heatmap that produces an ASCII-art
heatmap from GPS track data read from standard input. We will run
the Heatmap program with a command line like
The corresponding heatmap is then written to standard output in a format
like
.:#xx
#x:x:
xX:::
.::::
where, for this example
. represents a cell containing 0 track points,
: represents a cell containing 1 track points,
x represents a cell containing 2 track points,
X represents a cell containing 3 track points,
@ represents a cell containing 4 track points, and
# represents a cell containing 5 or more track points.
where . represents a cell containing between 0 and 2 track points
(inclusive),
o represents a cell containing between 3 and 5 track points
(inclusive), and
0 represents a cell containing between 6 or more track points
(there aren't any in this example).
Implementing the track ADT
The header file /c/cs223/hw3/Required/track.h specifies
the public interface for a track abstract
data type (ADT), which models a GPS track. You must implement
that ADT and it will be tested separately.
Refer to the documentation in the comments in the header file for
the required behavior of each function.
You may not change the header file,
but you may include other helper functions that are not visible to
other modules in your implementation file.
The /c/cs223/hw3/Required
directory also contains the required header and implementation files
for location and trackpoint ADTs and you
may not change those either.
Your track ADT will be tested with a series of unit tests that
test individual functions. An incomplete suite of unit tests is implemented
in /c/cs223/hw3/Required/track_unit.c, which will be replaced
with a complete test suite for the private test script. The public
and private unit test modules will each
contain a main function that you must link with your
track implementation to produce an executable
called Unit that executes the unit tests.
Examine the public track_unit.c to see how the individual tests
work.
Details
Command-line arguments
the width and height of the heatmap grid cells will be positive
and are given
in degrees of longitude and latitude in a format
readable by atof
the string of characters used in the heatmap will be non-empty
the size of the ranges represented by each character is
given as a positive integer $n$ in a format readable by
scanf with the %d format specifier
if the length of the string of characters is $m$
then the ranges represented by each character
are $kn, \ldots, (k+1)n-1$ for k = $0, \ldots, m-2$,
and $(m-1)n, \ldots, \infty$.
Standard input
each non-empty line of input read from standard input will contain one
trackpoint
the latitude and longitude for each trackpoint
will be given in degrees in a format
readable by scanf with the %lf format specifier
the latitides and longitudes will satisfy the preconditions
of trackpoint_create
the time for each trackpoint is given as the number of
milliseconds since January 1, 1970 in a format readable by
scanf with the %ld format specifier
all three fields will be separated by single space characters,
with no other whitespace on the line aside from a newline that
marks the end of each line
the track points will be given in order of
increasing timestamp
there will be a single empty line used
to separate the second and subsequent segments from the
previous segment
if there is more than one segment then they will all be non-empty
Building the heatmap
the top edge of the heatmap is the latitude of the northernmost point
in the track
Considering the left edge of the heatmap to be the longitude
of the track point with the lowest longitude would present problems
when the track crosses between the eastern hemisphere (positive
longitudes) and western hemisphere (negative longitudes).
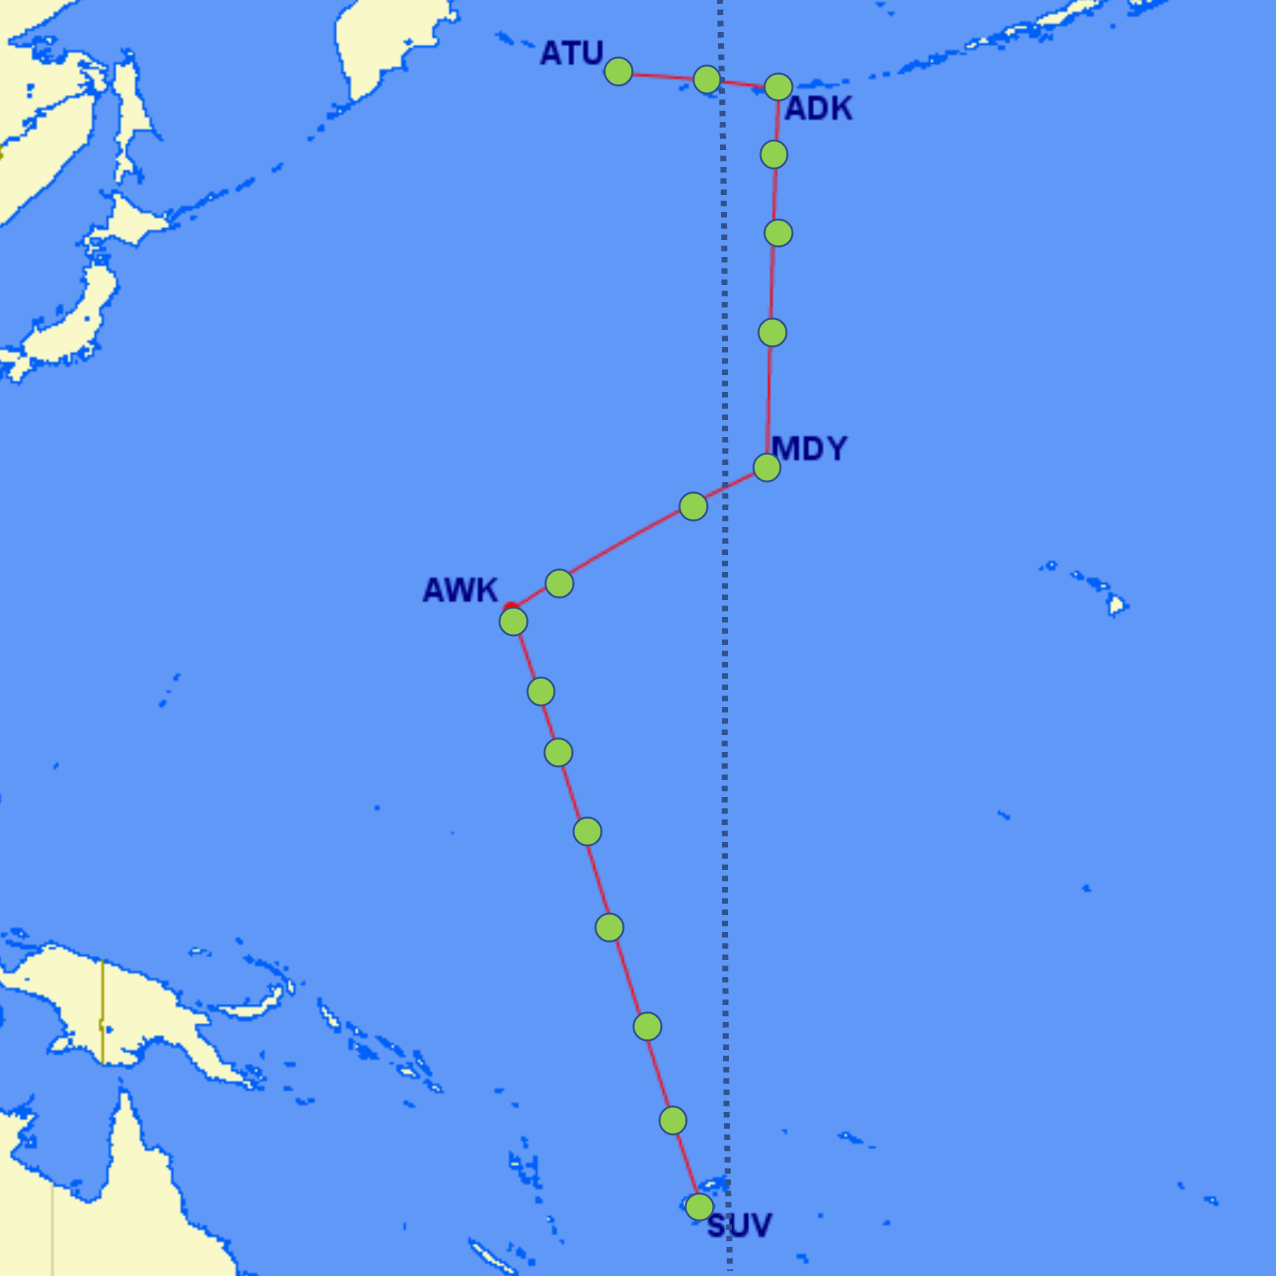
For example, using the most negative longitude for the track
shown below
would result in something like
In order to ensure the latter output, we determine the westernmost edge
of the heatmap by finding the smallest spherical wedge
(the surface between two meridians of longitude) that contains all
of the track points, and taking the western edge of that
wedge to be the western edge of the heatmap (the "western edge"
here is the edge from which moving east keeps you in the region).
If there are multiple such wedges, choose the one with the lowest
normalized longitude
(adjusted to the range -180 (inclusive) to 180 (exclusive)) of
the western edge.
the number of rows and columns in the heatmap is such that
every track point is contained in a cell, and neither the
easternmost column nor the southernmost row is empty (unless the
track is empty, in which case the heatmap has one cell)
heatmap cells include their northern and western edges,
but not their southern or eastern edges,
except for the bottom row and right column, which do include
their southern and eastern edges respectively
the above two rules mean that the output should not contain
an extra row or column just to contain track points that would
otherwise be on the edge of the heatmap; see the example below
a track for which the count array should be
7
,
not
41
11
when the heatmap grid wraps all the way around the earth so the
easternmost column overlaps the westernmost, count points
only in the leftmost cell they belong to
consider track points at the poles (where all longitudes refer to
the same point) to have whatever longitude
was read from standard input
Output
the output should be a heatmap representing all trackpoints and all
segments read from standard input, as specified by the track_heatmap
function in the track ADT, using the cell width and height
given on the command line.
each row of the heatmap should be written
to standard output on a separate line, with the first character written
corresponding to the first column of the first row of the heatmap
each integer value in the heatmap should be replaced with a single
character as determined by the last two command-line arguments as
described in the command-line arguments section
there is no space between characters in the same row and nothing
at the end of a line except a newline character
there should be no other output to standard output or standard error
Efficiency
track_create must run in $O(1)$ worst-case time
track_destroy must run in $O(n)$ worst-case time
track_count_segments, track_count_points,
and track_get_point must run in worst-case $O(1)$ time
track_get_lengths must run in worst-case $O(m)$ time
track_add_point and track_start_segment
must run in amortized $O(1)$ time (so any sequence of $k$ such
operations must take $O(k)$ time total in the worst case)
track_merge_segments must run in worst-case $O(n)$
time
track_heatmap must run in worst-case $O(n \log n + p)$ time
All time bounds assume that $n$ is the number of total points in the
track, $m$ is the number of segments, $p$ is the number of cells in
the heatmap, and that malloc and
free work in $O(1)$ time (note that this assumption does
not extends to calloc, realloc or similar
functions).
Testing
When the input (standard input or command-line arguments) are invalid,
the output of your program is ignored and it must not crash or hang.
Your Heatmap program
must not produce any errors when tested
with Valgrind, whether the input is
valid or not. The unit test program Unit must
not result in errors from Valgrind for any test. None of the
public or private unit tests will violate the preconditions
of the track ADT functions, and so the behavior of your implementations
of those functions may be anything (including crashing and/or hanging).
You may assume that
memory allocations succeed, and so no error-checking is required
for calls to malloc.
Violations of the abstraction provided by declaring
trackpoint and track as opaque structs
will be considered a violation of good programming style and design.
Hints
Before you write any code, draw a memory diagram of your
implementation of a track, and diagrams of how the various
operations change a track.
You might find it helpful to write a helper function
track_bounds to determine the bounds of the track
according to the rules of the bounds of the corresponding heatmap.
You can start with an implementation that ignores the problem
of points near the -180/180 degree boundary between hemispheres
and just finds the minimum and maximum latitude and longitude.
The next step might be a version that does the right thing
for tracks with points near the boundary, but does so inefficiently.
The last step would be a version that meets all of the requirements,
including the time bound. That final version might have a specification
that looks like
/**
 * Determines: 1) the latitude of the northernmost and southernmost track points in the given track; and 2)
 * the meridian of longitude at the western edge of the smallest spherical wedge bounded by two meridians
 * that contains all the points in the track (the "western edge" for a nontrivial wedge being the one that,
 * when you move east from it along the equator, you stay in the wedge).  When there are multiple such wedges,
 * this function finds the one with the lowest normalized (adjusted to the range -180 (inclusive)
 * to 180 (exclusive)) longitude.
 *
 * @param trk a pointer to a valid, non-empty track
 * @param west a pointer to a double in which to record the western edge of the containing wedge
 * @param east a pointer to a double in which to record the eastern edge of the containing wedge
 * @param north a pointer to a double in which to record the latitude of the northernmost point
 * @param south a pointer to a double in which to record the latitude of the southernmost point
*/
static void track_bounds(const track *trk, double *west, double *east, double *north, double *south);
If the west edge and east edge of a heatmap with cell
width $w$ are $(lon_{west},lon_{east})$
where $lon_{west} \le lon_{east}$
then (ignoring special cases)
a point at longitude $lon$ belongs in column
$\left\lfloor \frac{(lon - lon_{west})}{w} \right\rfloor$.
If $lon_{west} \gt lon_{east}$
then the heatmap crosses the -180/180 longitude boundary
and the same formula works for longitudes
from the western edge to the -180/180 boundary
($lon_{west} \le lon \lt 180$). For other longitudes,
use the formula
$\left\lfloor \frac{(360 + lon - lon_{west})}{w} \right\rfloor$.
Submissions
Submit your makefile, log file, and source code necessary to build the
executables Heatmap and Unit using your makefile.
Your makefile should have rules with each of those executables as their targets.
Your makefile should assume that the files from
/c/cs223/hw3/Required have been copied into
the current directory but not that they are still in their original locations,
and you should not submit those files (if you do, they will be overwritten with
the copies from /c/cs223/hw3/Required).
![track point count within each cell: [[0,1,5,2,2],[5,2,1,2,1],[2,3,1,1,1],[0,1,1,1,1]]](track_segments_heatmap.png)
![a circle with points at -185, -165, -140, -100, 35, 80, 110, 160, and 170 degrees; wedges [-185,170], [160,110],
and [35,-100] containing all points; the [35,-100] wedge is the smallest
such wedge](heatmap_wedges.png)